Adobe Analytics integration
The Bazaarvoice web analytics integration solution measures customer interaction with Bazaarvoice-hosted, user-generated content (UGC). Each time a visitor to your site interacts with UGC or reaches a page on which UGC appears, Bazaarvoice sends information about that interaction to your Adobe® Analytics account.
Using the analytics reports included in your Adobe Analytics implementation, you can analyze conversion rates and other success metrics to determine the value of UGC on your business.
Provided Adobe Analytics meets the integration prerequisites, implementation with the Bazaarvoice solution requires no effort by your IT department.
This information is intended for implementation teams who want to integrate Bazaarvoice web analytics data, and for marketing and web analysts who want to maximize the benefits of this feature once implemented.
Analytics integration overview
Web analytics is the principal vehicle by which you can measure the impact of Bazaarvoice UGC on your site experience and your business. It involves the collection, analysis, and reporting of data that helps you:
- Identify the types of users who visit your site
- Determine the value of the actions performed during those visits
When visitors to your site interact with Bazaarvoice-hosted UGC, our analytics integration injects vendor-specific JavaScript tags that relay data to Adobe Analytics. After setting up segmentation and reporting in Adobe Analytics, you can compare the actions of visitors who interact with UGC to the actions of visitors who do not.
This approach provides you with the information you need to answer key business questions, such as:
- How many visitors to my site are viewing and sharing UGC with others?
- How does visitor interaction with UGC affect my most important business performance metrics?
- Which types of visitor interactions with UGC are most valuable to my business?
- Does interaction with UGC differ across my product categories or marketing channels?
- Do the effects of UGC on my business change as the volume of UGC grows?
- Are my marketing efforts helping to increase the usage of UGC on my site?
Analytics integration gives you the ability to answer these questions, and to develop short- and long-term strategies that help you reach your business goals. You can measure the value of UGC interactions on your site by examining how visitors’ interactions with UGC affect your KPIs. As business performance metrics differ greatly by industry, Bazaarvoice recommends that you use the most appropriate method for your particular business.
When determining the impact of UGC on your site, you should consider these metrics:
For e-commerce clients:
- e-commerce or add-to-cart conversion rate
- Average order value
- Revenue per visitor
- Cart abandonment rate
- New and repeat buyer percentages
For non-e-commerce clients:
- Percent of visits that locate a store or are referred to an online retailer
- Percent of visits that sign up for email
- Percent of visits that submit a lead form
- Percent of visits that request a quote
How does it work?
Each time a visitor interacts with Bazaarvoice-hosted UGC, Bazaarvoice executes a JavaScript tag to send information to your web analytics system. This tag identifies the type of interaction that occurred. Then, after you set up segmentation and reporting in Adobe Analytics, you can view and analyze the performance of your visitors who interacted with UGC versus visitors who did not.
Adobe Analytics uses these tagging, segmentation, and categorization methods:
- Tagging method—Conversion variables and success events through custom link tracking
- Segmentation method—DataWarehouse, ASI Slot, or Discover
- Categorization method—Report filters or Classifications
Tagging methods
Analytics integration with Adobe Analytics uses the following tag types to track user actions:
- Conversion variable (eVar)—Captures information about user interactions with Bazaarvoice and ties the interactions back to your success metrics.
- Success event—Counts the number of times that a visitor interacted with Bazaarvoice-hosted UGC.
Segmentation methods
A segment is a subset of visitors whose behavior you want to view and analyze. If you want to analyze traffic subsets such as Paid Traffic, Visits with Conversions, and Organic Traffic—or even to compare such subsets side by side in reports—segmentation allows you to isolate and analyze them.
When you set up reports in Adobe Analytics, comparisons are made between visitors who interact with Bazaarvoice and all of your site visitors. To compare visitors who interact with UGC to visitors who only view product pages, you must create a segment that looks only at product page visitors in DataWarehouse, SiteCatalyst v15, or Discover.
Categorization methods
Categorization refers to the process of making user interactions more human-readable by classifying them into predefined buckets, such as visitors who interact with UGC and the Bazaarvoice product.
To categorize visitor interactions, you can:
- Use report filters
- Create Classifications rules
Volume of server calls
Server call volume represents the number of server requests that you send to your web analytics provider. Like many web analytics solutions, Bazaarvoice measurements rely primarily on server calls. Specifically, analytics integration generates additional server call volume because Bazaarvoice sends interaction-related information to your web analytics provider each time a visitor interacts with Bazaarvoice-hosted UGC.
Most web analytics vendors typically charge their customers according to a system that is based on the number of server calls that they generate every month. If their customers exceed the contracted amount, then they pay significantly more for additional server calls. They may also feature a tiered-pricing plan in which their customers can purchase a bucket of server calls.
When you track visitor engagement with Bazaarvoice, you can expect an increase in server calls of around two percent. Unless you are at high-contract utilization, these additional server calls are not likely to raise your existing fees. Consult your Adobe Analytics representative if you have billing concerns.
Create and view reports
Analytics integration allows for the continuing analysis of the impact of visitor interaction with Bazaarvoice-hosted UGC on your key metrics. This information is immediately available on demand from Adobe Analytics. This topic describes how to generate reports that provide access to the information passed into Adobe Analytics.
Dimensions
These dimensions are used to capture information:
- Group—Answers the question "With what site content did the visitor interact?" and always contains the value
Bazaarvoice. - Product—Answers the questions "Where is the user?" or "Which feature is being used?" and contains one of these values:
RatingsAndReviewsQuestionsAndAnswers
- Event Name—Answers the question "What specific kind of event is this?" and can include values.
Event Name Value
Description
SubmissionSubmissionFormSubmit
Select Submit to submit the review submission form.
ClickSummaryStars
Select the stars in the summary to jump to the Reviews section.
HoverHistogram
Hover over the star rating in the summary to open the histogram.
ClickReadReviewsButton
Select Read Reviews in the histogram.
ClickReviewCount
Select Review Count in the summary to jump to the Reviews section.
ClickSummaryQuestionStats
Select Question Count or Answer Count to jump to the Questions section.
ClickWriteReviewLabel
Select Write a review in the summary to open the submission form.
AskButton
Select Ask a question in the summary to open the submission lightbox.
PaginateNext
Move to the next page of UGC.
PaginatePrev
Move to the previous page of UGC.
SortFeatured
Sort the Review section by Featured.
SortMostHelpful
Sort the Review section by Most Helpful.
SortMostRecent
Sort the Review section by Most Recent.
SortNegative
Sort the Review section by Lowest to Highest Rating.
SortOldest
Sort the Review section by Oldest.
SortPositive
Sort the Review section by Highest to Lowest Rating.
SortRelevancy
Sort the Review section by Most Relevant.
SortFeaturedQuestionsFirst
Sort the Question and Answer section by Featured Questions First.
SortHelpfulnessAnswersFirst
Sort the Question and Answer section by Most Helpful Answers.
SortHelpfulnessAnswersLast
Sort the Question and Answer section by Least Helpful Answers.
SortMostAnsweredQuestionsFirst
Sort the Question and Answer section by Most Answered.
SortMostAnsweredQuestionsLast
Sort the Question and Answer section by Answers Needed.
SortRecentAnswersFirst
Sort the Question and Answer section by Newest Answers.
SortRecentAnswersLast
Sort the Question and Answer section by Oldest Answers.
SortRecentQuestionsFirst
Sort the Question and Answer section by Newest Questions.
SortRecentQuestionsLast
Sort the Question and Answer section by Oldest Questions.
Filter1Star
Filter by 1 star in the Reviews section.
Filter2Stars
Filter by 2 stars in the Reviews section.
Filter3Stars
Filter by 3 stars in the Reviews section.
Filter4Stars
Filter by 4 stars in the Reviews section.
Filter5Stars
Filter by 5 stars in the Reviews section.
FilterClear1Star
Clear the 1-star filter in the Reviews section.
FilterClear2Stars
Clear the 2-star filter in the Reviews section.
FilterClear3Stars
Clear the 3-star filter in the Reviews section.
FilterClear4Stars
Clear the 4-star filter in the Reviews section.
FilterClearAll
Clear all active filters in the Reviews section.
HoverProfile
Hover over a profile name to open a profile.
ClickStars
Select the Stars next to a Review.
ClickUserSubmittedPhoto
Select a user-submitted photo below a Review.
ClickYesHelpfulVote
Select to vote a piece of UGC as helpful.
ClickNoHelpfulVote
Select to vote a piece of UGC as not helpful.
ClickReportLink
Select to report an inappropriate piece of UGC.
Tagging methodology
Bazaarvoice uses custom link tracking to pass information into a Conversion Variable (eVar). When this tag is sent to Adobe Analytics, Bazaarvoice uses the following structure to populate the eVar:
[Group] : [Product] : [Event Name]
Depending on how a visitor interacts with UGC, Bazaarvoice populates each dimension with a value. For example, if a visitor sorts the displayed reviews by most helpful, Bazaarvoice populates the eVar with the following values for each dimension:
Bazaarvoice : RatingsAndReviews : SortMostHelpful
Because Bazaarvoice passes a limited set of combined values into the eVar, the values can be easily categorized by using Classifications.
Reporting details
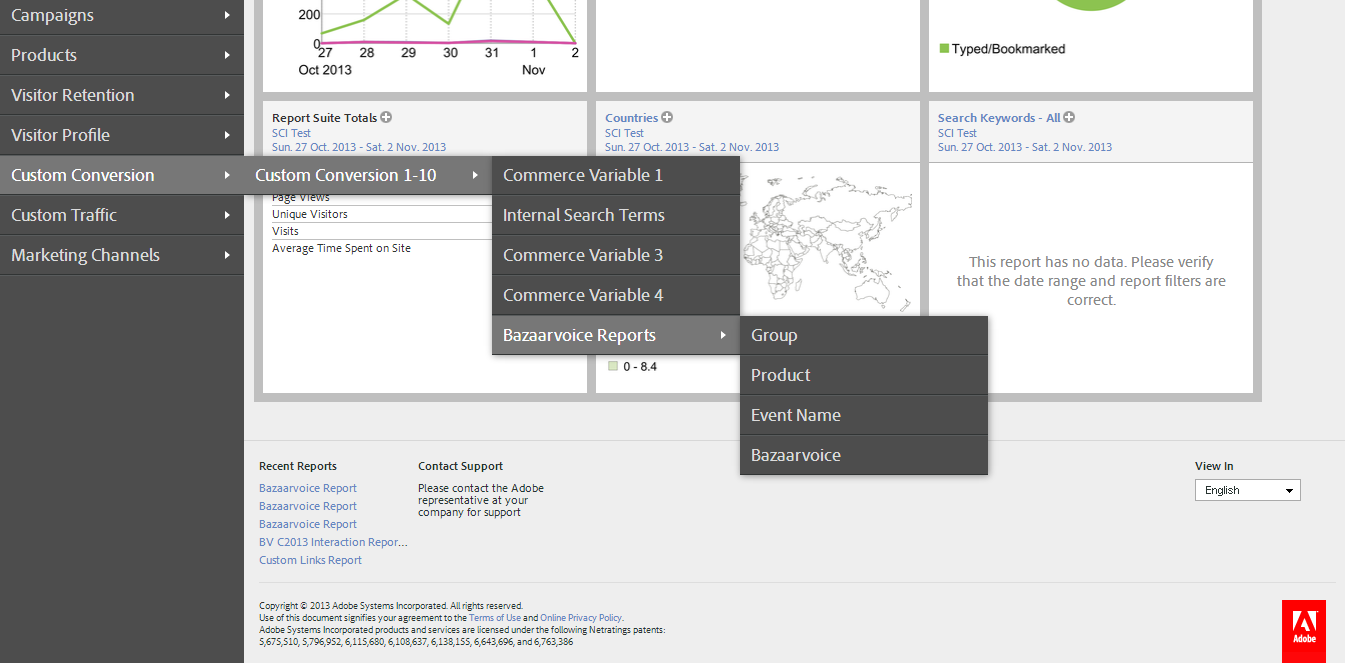
Because Bazaarvoice passes information about visitor activity with UGC into an eVar, reporting about Bazaarvoice activity can be found in the Custom Conversion reports in Adobe Analytics.
In the navigation panel, select Custom Conversion »eVar_Number» Bazaarvoice Reports »Report_Type, where:
- eVar_Number is the number that corresponds to the Bazaarvoice-provisioned eVar
- Report_Type is one of these report types:
Group report (optional, based on setting up Classifications)—Displays the metrics that correspond to the default Bazaarvoice value of the Group dimension, providing for the easy comparison of Bazaarvoice visitors to non-Bazaarvoice visitors.
Product report (optional, based on setting up Classifications)—Displays the metrics that correspond to the values captured by the Product dimension.
Event Name report (optional, based on setting up Classifications)—Displays the metrics that correspond to the values captured by the Event Name dimension.
eVar report—Lists the values that are passed to the eVar. This report typically is named "Bazaarvoice."
Create a new segment
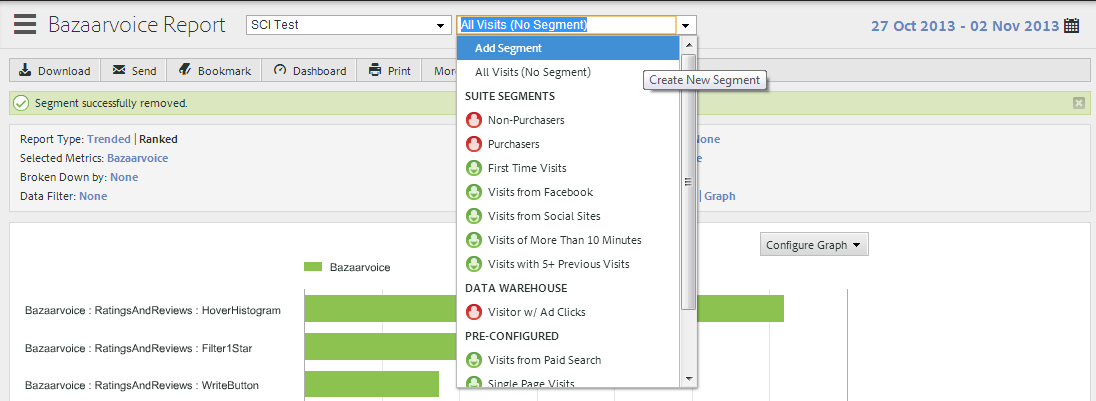
Bazaarvoice recommends setting up one segment to identify visitors to the product page. If such a segment doesn’t already exist, use the following instructions to create a new segment in the Segment Builder.
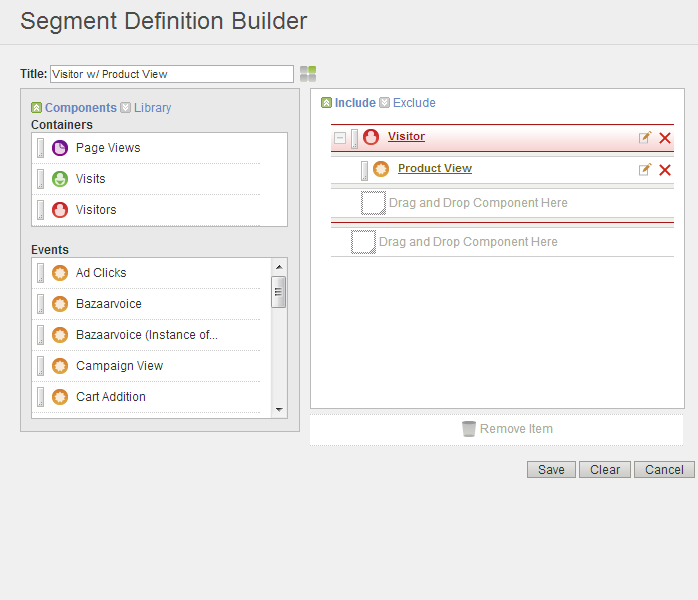
Segment: Visitor w/ Product View
- Sign in to your Analytics account.
- From the Segment dropdown menu on the Segment Builder, select Add Segment.
- Name the segment Visitor w/Product View.
- In the right panel, select Include.
- Drag the Visitors container to the right panel.
- Drag the Product View event to the right panel.
- Select Save.
Customize the eVar report
Use the following instructions to customize the eVar report to analyze performance of users who interacted with Bazaarvoice products and users who did not.
Example report: Visitors who used Bazaarvoice versus Visitors who did not use Bazaarvoice
- In the navigation panel, select the eVar report. This report typically is named "Bazaarvoice."
- From the Segment dropdown menu, select Visitor w/Product View.
- Select Ranked for Report Type.
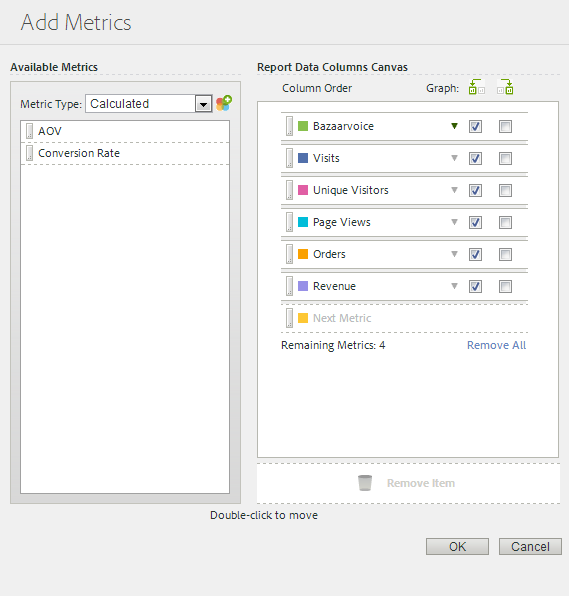
- Under Selected Metrics, select to open the Metric Selector.
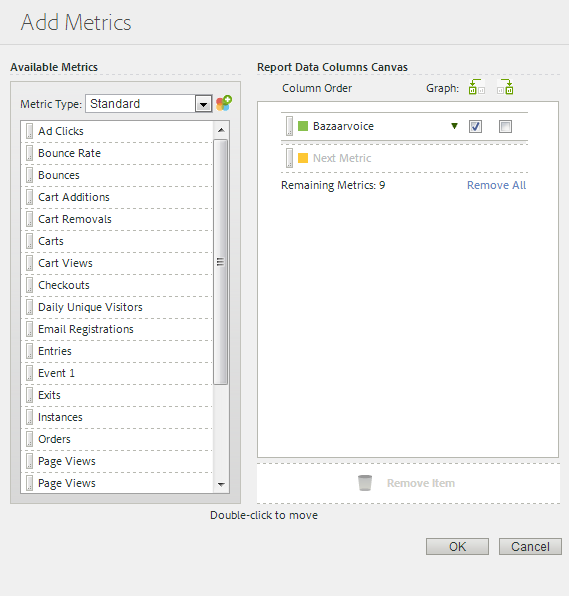
- Add available standard metrics such as:
- The Bazaarvoice-provisioned event, which is typically called Bazaarvoice or Bazaarvoice (
<event_number>). - Visits
- Unique Visitors
- Page Views
- Orders
- Revenue
- The Bazaarvoice-provisioned event, which is typically called Bazaarvoice or Bazaarvoice (
- Add available calculated metrics, such as:
- Conversion Rate
- AOV
- Select OK.
Example eVar report
The following image shows an example of a Bazaarvoice eVar report.
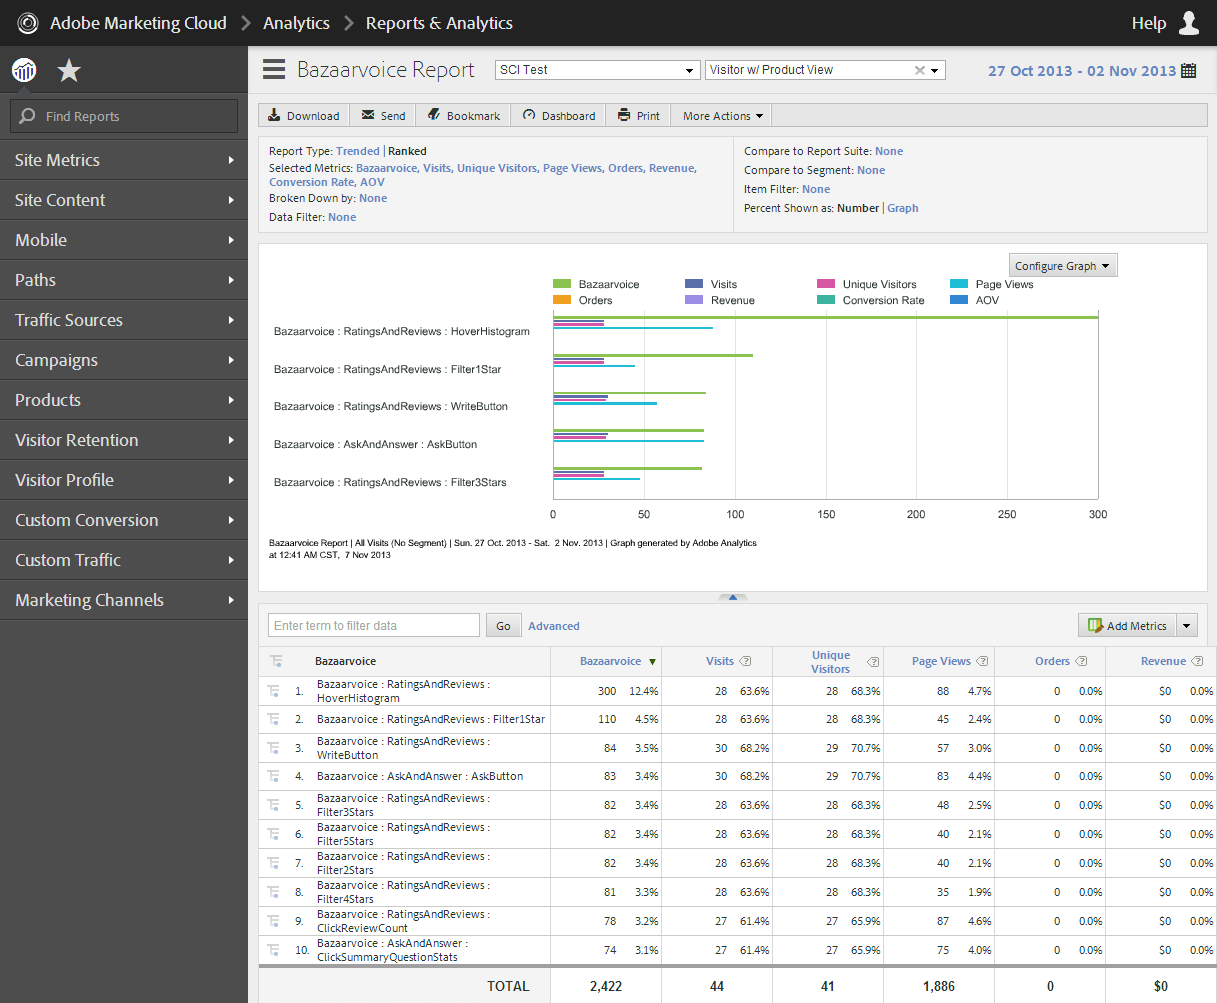
Report filters allow for easy categorization of visitors who used Bazaarvoice and visitors who did not use Bazaarvoice.
- The term "Bazaarvoice" can be used to filter only visitors who used Bazaarvoice. Refer to the TOTAL in the bottom row to measure how engaged visitors performed against each report metric.
- The term "None" can be used to filter only visitors who did not use Bazaarvoice. Refer to the TOTAL in the bottom row to measure how non-engaged visitors performed against each report metric.
- The term "RatingsAndReviews" can be used to filter only visitors who used Bazaarvoice Reviews. Refer to the TOTAL in the bottom row to measure how these engaged visitors performed against each report metric.
- The term "AskAndAnswer" can be used to filter only visitors who used Bazaarvoice Questions & Answers. Refer to the TOTAL in the bottom row to measure how these engaged visitors performed against each report metric.
eVar values and success event values are set on each visitor interaction with Bazaarvoice UGC. You should set the attribution of the eVar to Most Recent (Last) to give credit to any success event to a visitor’s last interaction with Bazaarvoice before completing the success event.
Set up analytics integration
You must satisfy these requirements before analytics integration can be implemented:
- Verify that you are currently using Adobe Analytics H code or App Measurement.
- Determine the eVar and success event that you want to use for Bazaarvoice reporting.
- Verify that your Bazaarvoice implementation is hosted; it cannot be an API-only solution.
- Verify that you are tracking KPIs through Adobe Analytics.
Provision the Bazaarvoice event and eVar
To receive Bazaarvoice analytics data in your Adobe Analytics account, you must first provision a Success Event and Conversion Variable for Bazaarvoice.
Here are the recommended settings for the Bazaarvoice-provisioned Success Event and Conversion Variable:
- Success Event (event) settings
- Name: Bazaarvoice
- Type: Counter
- Conversation Variable (eVar) settings
- Status: Enabled
- Name: Bazaarvoice
- Type: Text String
- Allocation: Most Recent (Last)
- Expire After: Custom (30 Days)
Configure Adobe Analytics settings
To set up and enable analytics integration:
- Sign in to the Bazaarvoice Portal
.
- Select Configuration from the Portal menu
 located in the upper-left corner.
 - Select an instance.
- Select Go to Configuration. The Site Manager appears, listing the available deployment zones and implementations.
- Under Implementations, use the filter to find the name of the implementation you require.
- Select Edit next to the implementation you want to edit.
- From the menu on the left side of the page, select Web Analytics under Settings.
- Enable and set up integration with Adobe Analytics, as follows:
- Under Enable web analytics integration (Adobe Analytics), select Enabled.
- Under Success event number (Adobe Analytics), enter the integer number of an available success event for tracking Bazaarvoice interactions. For example, enter 47 for the s.event47 event.
- Under Tracker object override (Adobe Analytics), enter the name of the Adobe Analytics tracker object variable. If you leave this field blank, the system assumes that the default tracker object is "s."
- Under Conversion variable number (Adobe Analytics), enter the integer number of an available conversion variable for tracking Bazaarvoice interactions. For example, enter 23 for the s.eVar23 variable.
- Deploy the changes to the implementation.
- Create reports as needed. </ol> </div> </div> </div>
Note: You can also add new deployment zones and implementations on this screen.
